
Comfort and fit measurement with tactile sensing
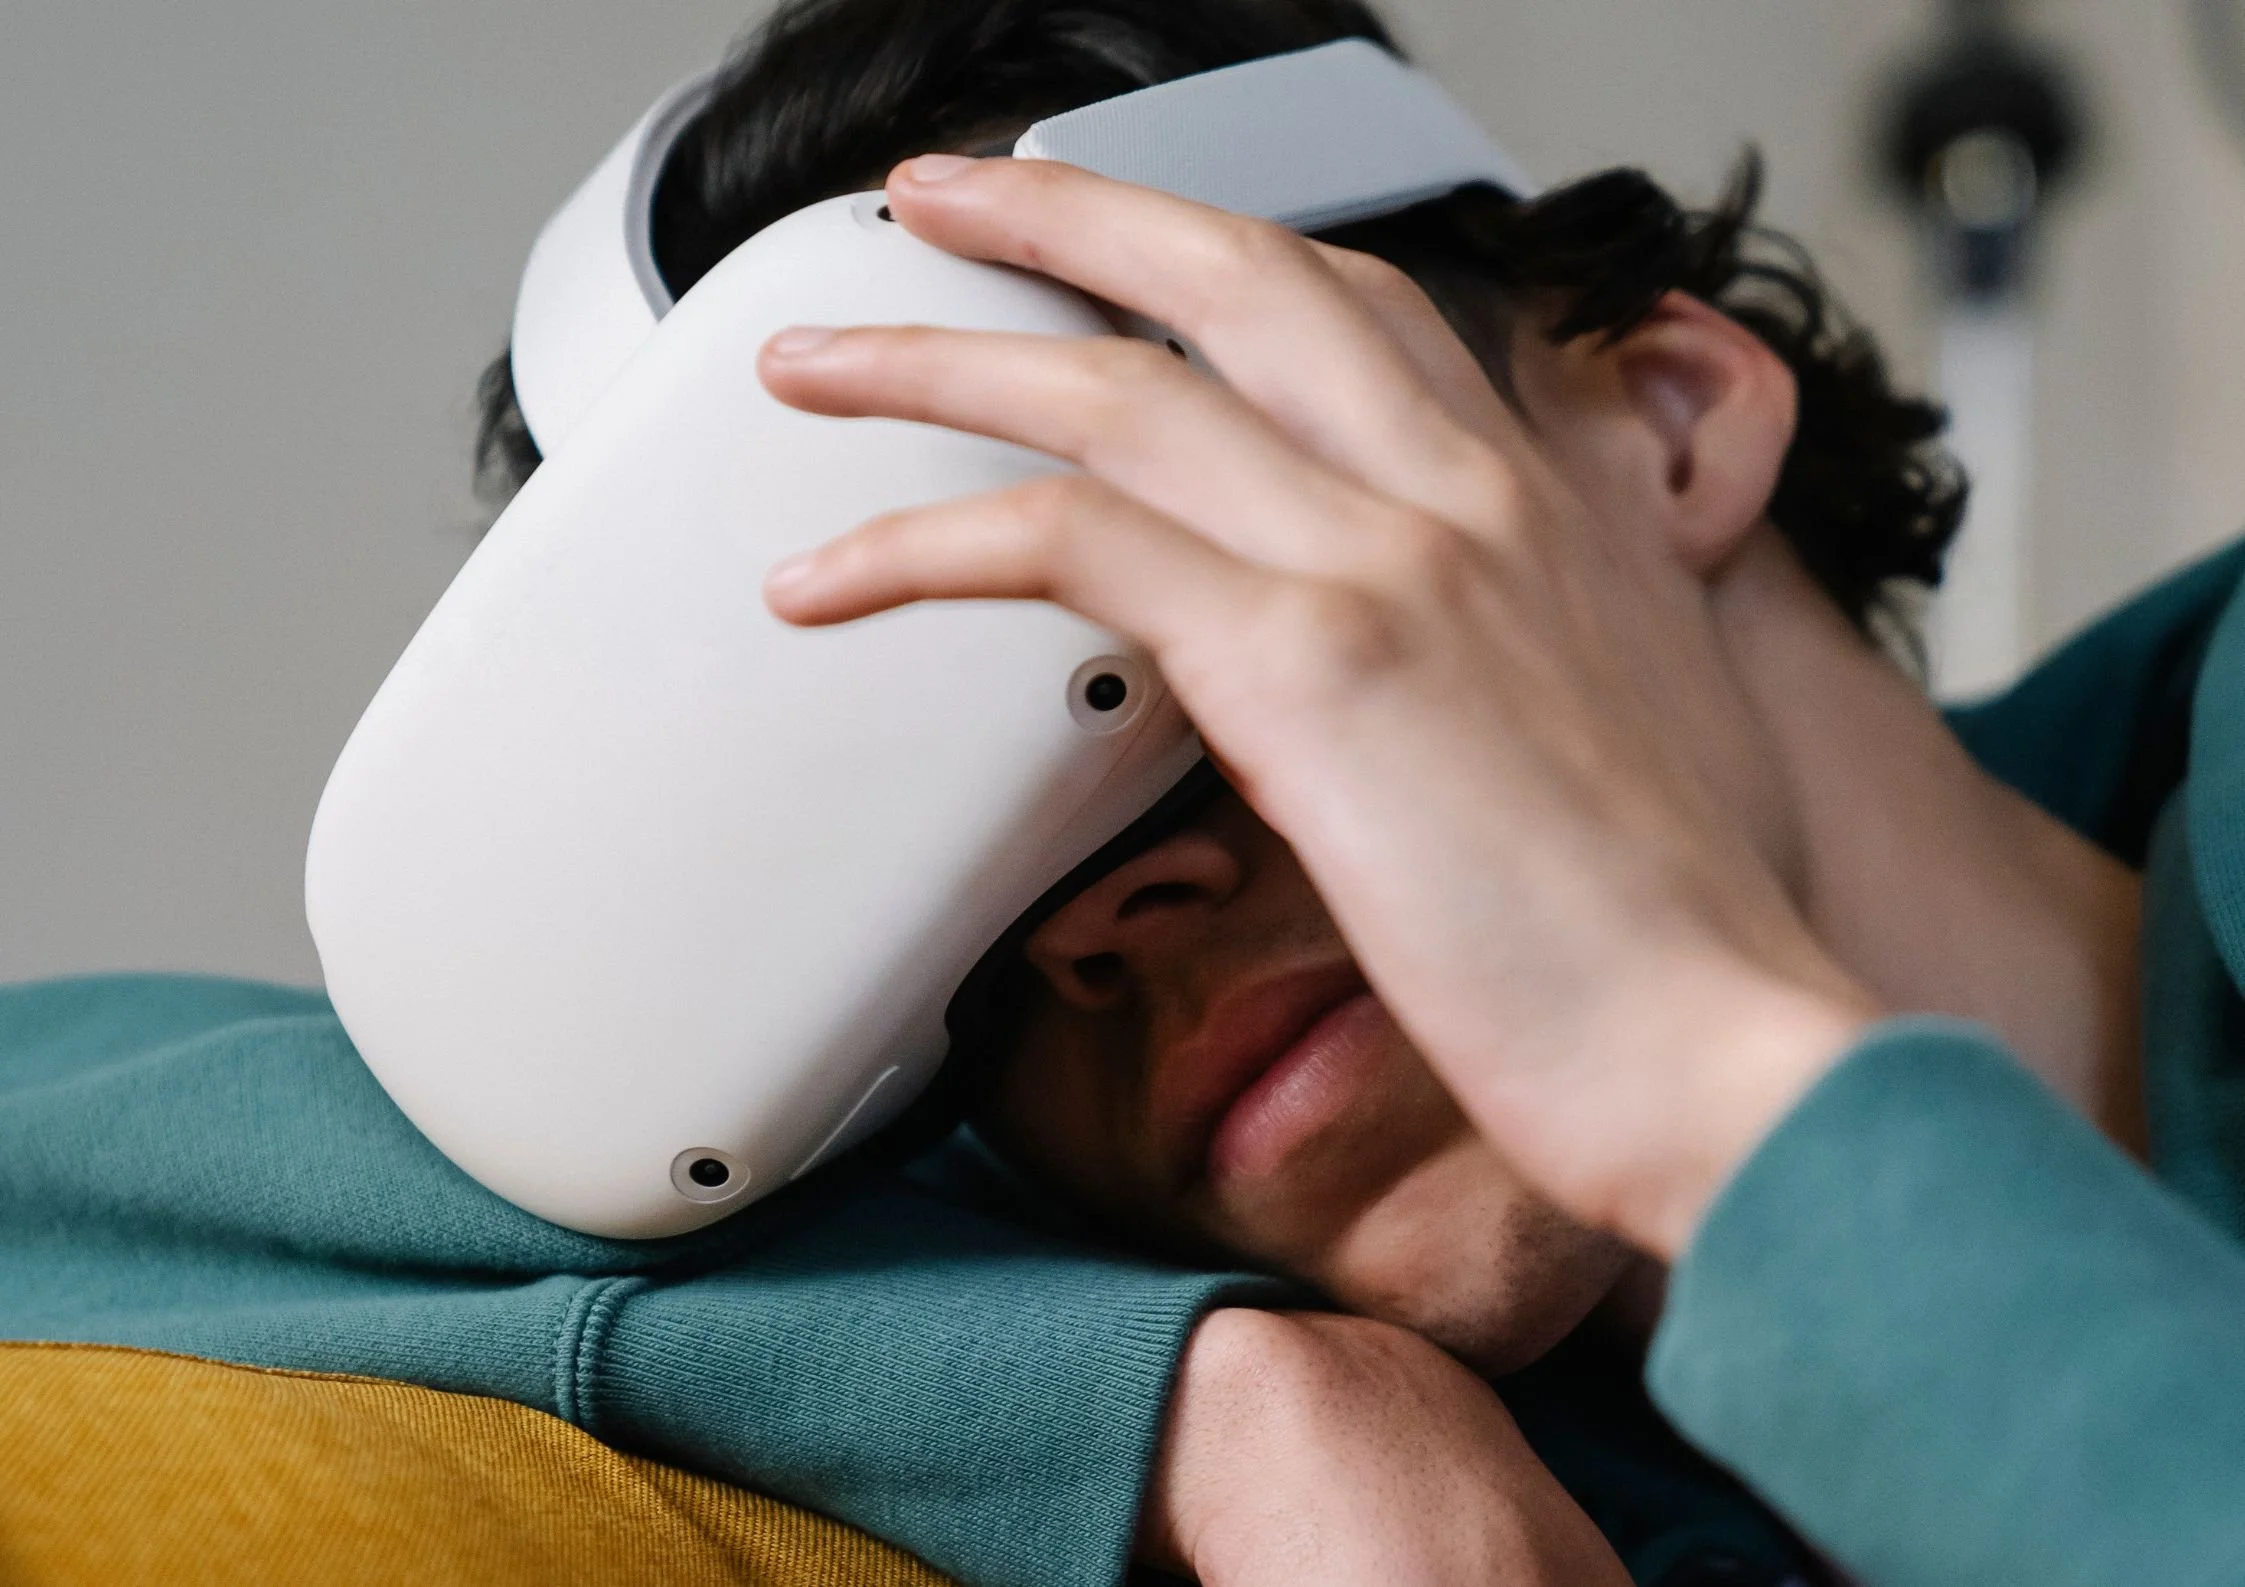
Two users may describe the same device as "comfortable" while experiencing very different pressure distributions across the face.
Designing a product that sits against the human body introduces a problem that is easy to describe and surprisingly hard to solve: how do you know it actually fits well?
For most development teams, the answer relies on user feedback. Test participants wear the product, complete a survey, and describe what they felt. The responses vary between individuals and shift with fatigue, expectation and environment. Human-centred design frameworks recognise this limitation. Subjective feedback captures perception, not the underlying physical interaction driving it. And you cannot engineer your way out of a problem you cannot measure.
Where measurement is introduced, it is typically simplified to a single value: peak pressure. A device with lower peak pressure is assumed to be more comfortable. In practice, this does not hold. A small concentrated pressure point can feel uncomfortable even when overall force is low. Higher pressure spread evenly across a larger surface can feel perfectly fine.
Research into wearable comfort and fit confirms that comfort is a multi-dimensional response shaped by how pressure is distributed, how rapidly it changes across a surface, and how load is shared across the interface. A single number does not capture any of that.
What measuring comfort and fit actually requires
The problem with single-point measurement is not just resolution. It treats the interface between two surfaces as if it has one answer. A pressure sensor placed at a single location tells you what is happening there. It tells you nothing about the distribution across the rest of the contact zone, where the real fit story is.
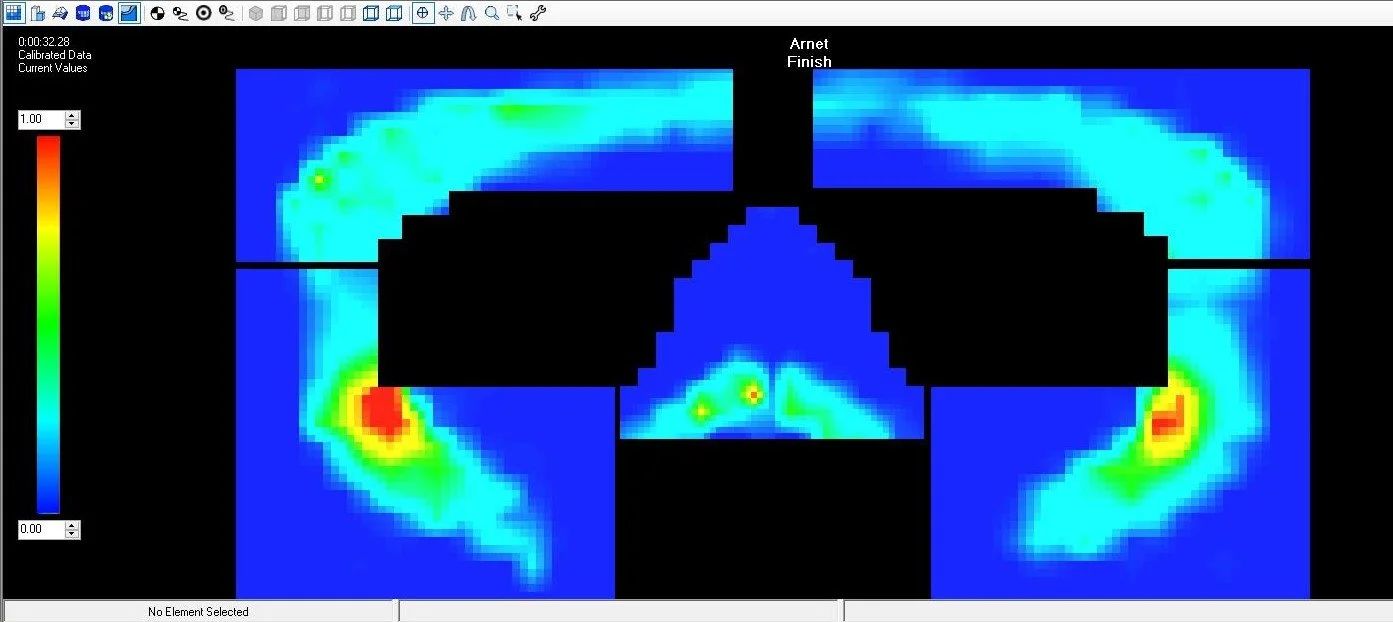
Tactile sensors replace that with a complete picture. An array of sensing points maps tactile pressure simultaneously across the full interface, showing where load concentrates, where contact is limited, and how pressure shifts under realistic conditions. Because the array conforms to curved surfaces and captures data at every point rather than averaging across a region, it reveals the texture of the pressure distribution, not just its magnitude.
Three parameters together define how someone experiences a wearable product. Peak pressure identifies concentrated loads that signal localised discomfort. Pressure gradient describes how sharply force transitions between contact regions; a smooth distribution feels different from an abrupt one even at identical peak values. Contact area determines how contact pressure is shared and whether force pathways are stable or shifting during use.
Evaluating these three factors together gives engineers a basis for design decisions that subjective feedback cannot provide. Material changes, geometry adjustments and closure refinements produce measurable outcomes rather than changed opinions.
Where the gaps appear
The same measurement gap appears across product categories. Whether the interface is a headset, a watch strap, a load-bearing harness or a medical garment, the underlying problem is consistent: point measurement captures a local value while the fit behaviour that matters is distributed across the whole contact surface. These are four of the contexts where that gap has the most significant consequences.
Head and face interfaces
A retention system on a helmet or headset redistributes load across the cranial surface every time it is tightened. The pressure applied at any one point changes depending on head shape, adjustment position and how the padding has settled under sustained load. A pressure sensor at a single location captures one state of that interaction. It does not show what is happening across the rest of the contact geometry, or how a different head shape changes the picture entirely.
Comfort complaints that arrive after product launch, concentrated in a specific location, are almost always the result of a distribution problem that point measurement never revealed.
For VR and AR headsets the stakes are higher still. Facial interface comfort determines whether a device gets used beyond the first session. The seal geometry, foam specification and strap tension all interact across a contact zone that spans curved surfaces from the forehead to the cheekbones. Pressure mapping across that zone during fitting and adjustment makes those interactions visible and comparable across iterations.
PPS developed TactileHead for this geometry: a modular pressure mapping system that conforms to the cranial surface, placing pressure mapping sensors across helmets, headsets and facial interfaces to capture distributed contact pressure data.
Body-worn devices and apparel
A strap that fits well on the test population may concentrate load on the ulnar edge of the contact zone on a narrower wrist, or lose contact area on a flatter one. Neither shows up in wear trial feedback until enough users have experienced it. By then the design is locked, the tooling is cut, and the fix is expensive.
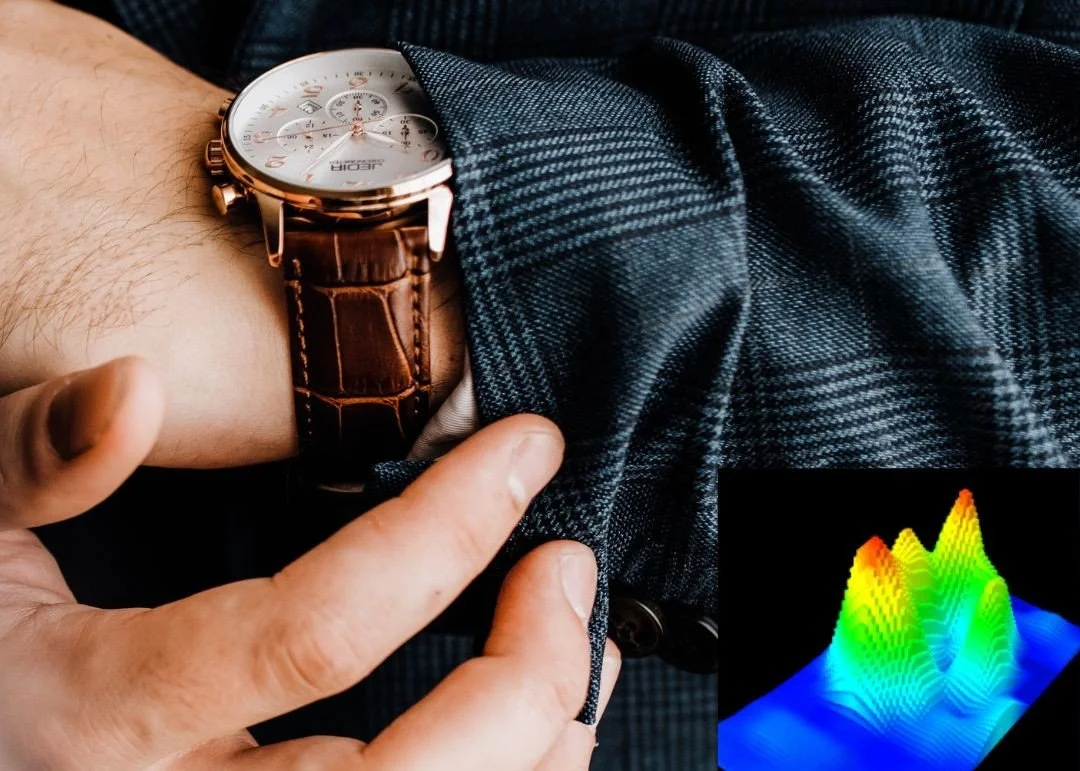
For products worn continuously against the skin — smartwatches, fitness trackers, medical wearables and performance garments — that variability is the central fit problem. Extremely thin flexible tactile sensors placed along the contact surface map exactly how pressure is applied between two objects as different as a watch strap and a wrist, across different profiles and soft tissue types, before wear trials begin rather than after.
Studies of why users stop wearing activity trackers find that comfort issues are among the most frequently cited reasons, and that they correlate more strongly with reduced usage than almost any other factor. A 2020 abandonment study found fit and comfort to be among the strongest predictors of discontinuation. A device that does not fit comfortably is not worn continuously, and a device that is not worn continuously cannot deliver continuous data. Fit is not a refinement.
PPS has developed custom wrist sensors for premium watch and strap design that provide this data across the wrist profiles and wear conditions that matter most.
Load-bearing equipment
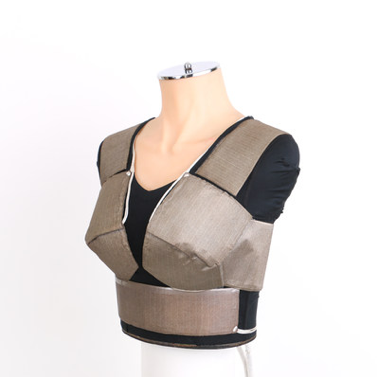
Under dynamic loading the problem compounds. A harness or waist belt that distributes load acceptably in a static test changes its behaviour the moment the wearer moves. Pressure builds gradually on contact points that looked acceptable on the bench, often at predictable locations such as the top edge of a waist belt or the inner face of a shoulder strap where webbing transitions to padding.
Conformable tactile sensing strips placed along shoulder straps, waist bands and back panels apply pressure mapping technology to capture how contact pressure develops and shifts continuously across contacting surfaces during use. Precise data collection across the full contact zone gives engineers the information to make targeted adjustments under the conditions that actually produce the problem.
PPS developed a Conformable TactArray for this geometry: a flexible sensing strip that follows contact surfaces across shoulder straps, waist bands and back panels, capturing how pressure distribution shifts continuously during use.
Skin-contact and precision fit applications
When the contact surface is irregular, soft and clinically significant, peak pressure as a single metric is not just insufficient. It can actively mislead. A reading within acceptable range at one location says nothing about what is happening across the rest of the interface, or whether the distribution as a whole is producing the intended therapeutic or functional effect.
A compression stocking operating outside its therapeutic pressure window fails clinically. That window varies across leg geometries, and a single peak reading will not tell you whether you are inside it. A nappy (diaper) concentrating load on the wrong region of a soft, irregular surface fails on its primary purpose. In both cases the pressure distribution is the only reliable signal available.
Subtle variations in surface behaviour that appear acceptable at a gross level can still produce localised gradients that undermine performance. PPS has built custom sensing solutions for this class of problem, including mannequin-based systems for nappy fit evaluation and sensor configurations for compression stocking tightness and bra fit optimisation, where repeatable measurement across controlled geometry is more informative than human wear trials alone.
What becomes possible when you can measure it
When the full pressure distribution is visible, design decisions have a foundation they did not have before. Iterations can be compared on the same terms. A geometry change that reduces peak pressure without improving gradient or contact area can be identified before it becomes a design direction. A closure adjustment that redistributes load favourably on one body type but concentrates it on another can be caught in development rather than in returns data.
The endpoint of that capability is a single comparable metric. Because comfort cannot be defined by any one parameter, comparing designs requires a framework that weights all three factors consistently.
The Comfort and Fit Index developed by PPS combines peak pressure, pressure gradient and contact area distribution into a single normalised score, calibrated against real user comfort ratings for the specific application. Design iterations can be scored against each other under controlled conditions, giving engineering and product teams a shared basis for decisions that does not depend on which parameter they happen to prioritise that week.
Proper fit is measurable. The question is whether you are measuring enough of it.
Explore further
→ How tactile sensing works - Tactile sensing overview
→ Ready to discuss your application - Contact PPS