Chameleon Software: Sensor Data Visualization
Supplied with every sensor system at no additional cost, Chameleon software is a full-featured, intuitive platform designed to help your team efficiently manage, analyze, and visualize tactile sensor data in real time. With its easy-to-use interface and flexibility, users can find smarter answers through a variety of customizable heat-map and graph displays. Whether working on a research project, industrial application, or product development, Chameleon software provides the resources needed to control, interpret, and export data seamlessly.
Visualize your data in a smarter way with an extensive variety of display options, including Line Trace, 2D Heat-Map, 3D Heat-Map, and Mesh plots. Captured data can be analyzed using interactive tools, screen-recorded for easy team collaboration, and exported for further analysis in Excel®, MATLAB®, and Mathcad®. With its fun and engaging visualization tools, users love the ability to turn complex sensor outputs into meaningful insights.
特徴:
同時に複数のPPSシステムとのインターフェースが可能。
圧力分布画像データの記録、注釈付加、および編集が容易。
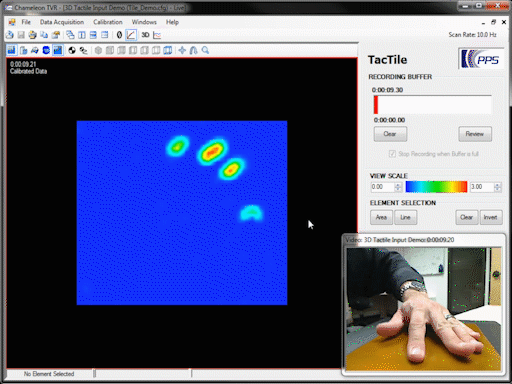
View and control synchronized video alongside your pressure analysis.
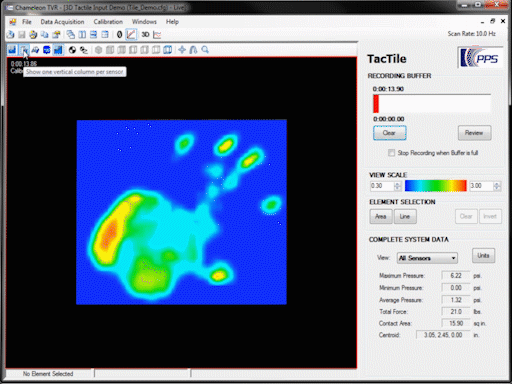
Access real-time data, including average, max, and center-of-pressure tracking.View sensor data as a 3D colour map of the actual shape
Visualize sensor data as a 3D color map of the actual shape.
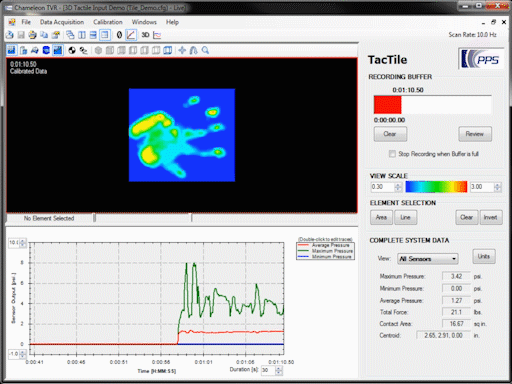
Export data in ASCII format for use in external software such as Excel®, MATLAB®, and Mathcad®.
Develop Windows apps using our simple API.
最新のアップデート:
ビデオ処理と解像度の向上
Enhanced control over recording length and speed.
複数圧力分布の可視化ツールによるリアルタイムのデータ表示。
Customization options for data export settings.
記録の長さと速度に対する制御の向上
実験結果に対する注釈付加機能の強化。
Auto-save and recovery functions to prevent data loss.
Ability to print, export as images, and copy-to-clipboard for seamless integration with other applications
ツールチップと改善されたヘルプ機能
センサーマッピング
複数のセンサーにまたがってデータを簡単にマッピング
あなたの触覚センサーは、わずか4つ、あるいは何千ものセンサー素子を持つことができます。各静電容量検出子はデジタル出力に変換され、カメレオンにライブ送信されます。これらのデジタル値は、PSIやkPaなどの物理的な圧力単位に変換され、実際のセンサーの形状を表すように空間的に整理されます。表示する特定のセンサーを選択するか、全体として表示して2 Dまたは3 Dのマップに表示することができます。
可視化
データを効果的に視覚化する
触覚センサーの出力は、2 D擬似カラーマッピング(圧力マッピング)、または接触圧力に関する情報を空間的に提供する3 Dバーまたはメッシュグラフプロットで覚化できます。少数のセンシング素子(約1ダース)用のセンサでは、経時的な圧力の履歴を提供するタイムトレースプロットで各素子を視覚化できます。多数のセンシングエレメント(数百または数千)の場合は、圧力マッピングに加えて、ピーク、平均、または最小圧力値、あるいは力と接触面積をプロットできます。
分析とデータのエクスポート
重要なデータポイントにすばやアクセスし、さらに分析するためにエクスポートする
Chameleonの分析機能には、ピーク圧力、重心、接触面積、および力の計算が含まれますが、その主な目的はセンサー電子機器から触覚データを収集し、それらをユーザーに視覚的に表示することです。テキストファイルとして収集されたデータの全部または一部をエクスポートする機能は、MatlabやExcelなどのプログラムによるより詳細な分析には標準的なものです。データをビデオ録画にエクスポートしたり、スクリーンショットをコピーして画像やプレゼンテーションに貼り付けることもできます。
同期ビデオ
センサーデータの横にある実際の実験を見る
圧力マッピングがそれを生成したものと相関させることができるようにビデオはあなたの実験を記録します。特定のイベントや時間を記録するには、ライントレースをダブルクリックすると注釈ボックスが開き、データセット内の特定のイベントと時間を記録できます。